Photodynamics Simulations with ALICA and SASS
Extensibility is a core design principle of ALICA. If the builtin components do not suit the needs of your application, then you can write your own set of tools using the frameworks of ALICA and Micro-Manager. Alternatively, you may find that ALICA already suits your needs but you need to do some testing in a controlled environment prior to using it in your measurements. We developed the STORM Acquistion Simulation Software (SASS) to assist in both of these situations.
This document explains how to setup SASS to test ALICA in a fully controlled simulation environment.
Install the Simulation Environment
SASS and ALICA are both distributed as Java .jar files. In addition to these you will need to download our Image Injector plugin, a Micro-Manager plugin which allows you to simulate acquistions by feeding images from a .tif file into the Micro-Manager live window. To install these files, you simply download the latest .jar from the Releases page of the respective projects and copy the files into the appropriate directories.
Micro-Manager 2
Before starting, you need the latest nightly build of Micro-Manager 2.0 (or higher).
- Go to https://www.micro-manager.org/wiki/Version_2.0 and download the latest nightly build for your system.
- Install Micro-Manager. Make note of the installation directory since you will need it later to install the .jar files.
ALICA
- Navigate to https://github.com/MStefko/ALICA/releases and download ALICA.jar from the latest release.
- Copy ALICA.jar to the MM2ROOT/mmplugins directory, where MM2ROOT refers to the installation directory of Micro-Manager.
SASS
SASS is a Fiji plugin and is not intended to work with the same copy of ImageJ that is used by Micro-Manager. This is because SASS has its own internal copy of ALICA that conflicts with Micro-Manager’s copy.
Do not install SASS in the same directory as Micro-Manager.
Instead, we will install SASS in a separate Fiji installation.
- If you have not already done so, download a copy of Fiji from http://fiji.sc/ and unpack it. Make note of the directory in which you installed it.
- Navigate to https://github.com/MStefko/SASS/releases and download SASS_VERSION.jar from the latest release. VERSION will vary depending on the latest release.
- Copy the SASS .jar file to FIJIROOT/plugins directory, where FIJIROOT is the installation directory of Fiji. (Note that the folder this time is plugins, not mmplugins.)
Image Injector Plugin
- Go to https://github.com/MStefko/ImageInjectorPlugin/releases and download the ImageInjector.jar file from the latest release.
- Copy the .jar file to the MM2ROOT/mmplugins directory.
Simulation Workflow
The workflow goes as follows:
- Use SASS to simulate a time series image stack of a PALM or STORM experiment and save the stack as a .tif file.
- Use the Image Injector Plugin to feed the images in the stack into the Micro-Manager live window.
- Run ALICA in virtual mode and observe how it responds to the simulated conditions in the image stack.
Step 1: Simulate a PALM/STORM Experiment with SASS
If you do not already have a .tif file of a time series image stack from a PALM/STORM experiment, you can simulate one by following the steps in this section.
- Launch Fiji.
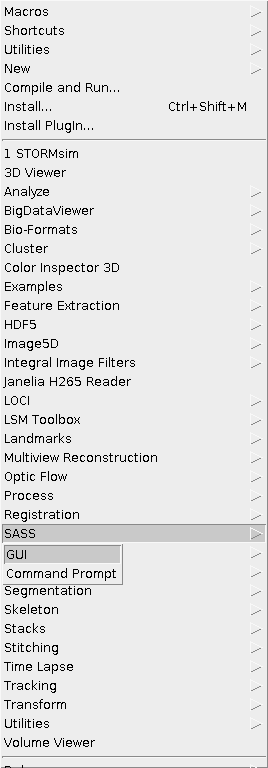
- Verify that the SASS plugin is recognized by Fiji and runs by clicking to Plugins > SASS > GUI in the ImageJ menu bar.
- The GUI configuration window for the SASS simulation environment should appear. Select your parameters for the simulation. A full description of the simulation parameters is outside the scope of this documentation. However, you will want to set the Controller setting to Manual since we want only a simple simulation where we manually select the laser power.
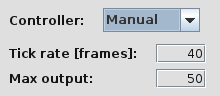
- Remember the value for the Max output parameter. This is the maximum output power of the simulated laser, and you will need it in a later step.
- Once everything is set, click the Initialize button to initialize the simulation.
- Set the Set Point value to something smaller than the value of Max output. This value determines the output power of the simulated laser.
- When ready, start the simulation by clicking the Start button. This will begin to populate an image stack with simulated STORM/PALM images.
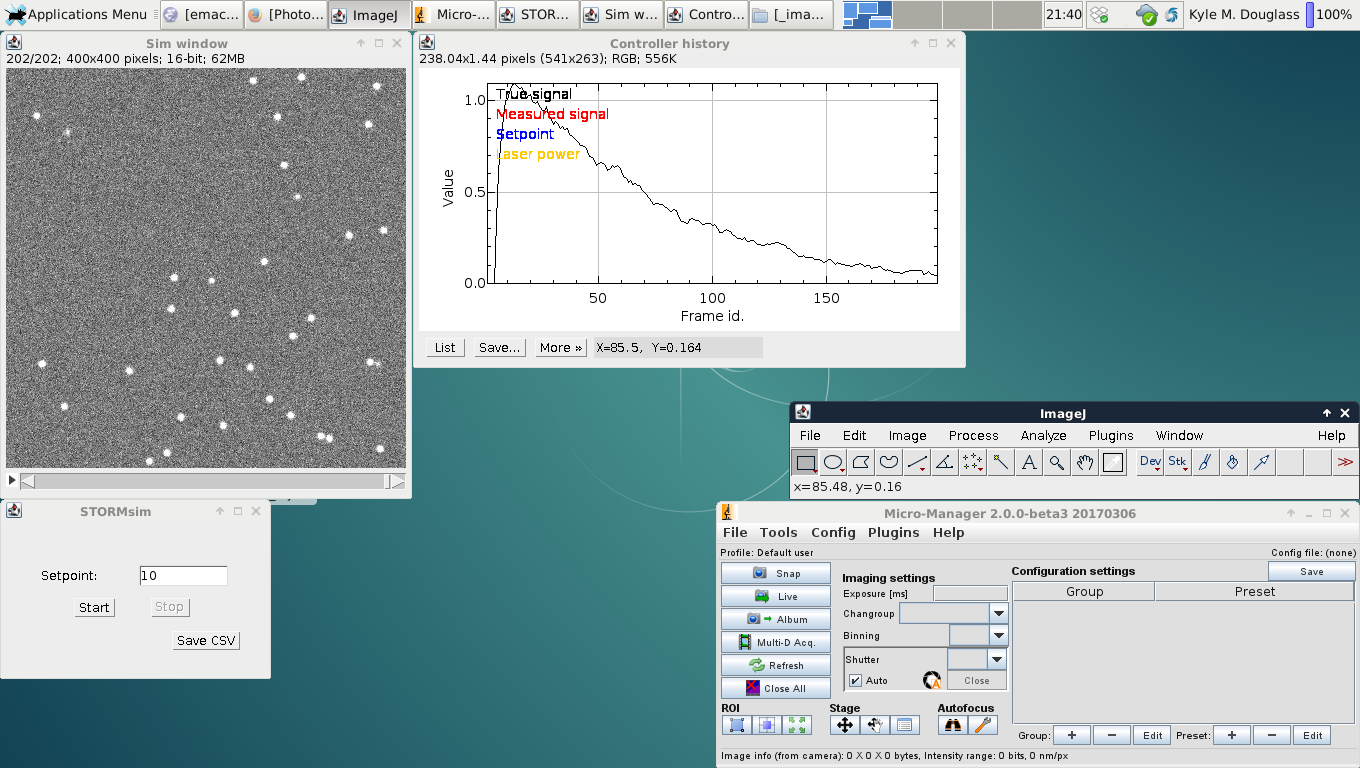
- You may stop the simulation and change the laser output power by clicking Stop in the STORMsim window and adjusting the set point. Click Start to pick up where the simulation left off with the new laser power.
- Once you have simulated a desired number of images in the stack, save the image stack by navigating to File > Save As > Tiff… in the ImageJ menu bar.
From this point you have two options for further exploration. You can use SASS to directly test the different analyzers and controllers. Or, you can continue further to directly test ALICA in a simulated Micro-Manager acquisition.
Step 2: Setup the Image Injector Plugin
Once you have a .tif stack, the next step is to setup the image injector to simulate a Micro-Manager acquisition.
- Launch Micro-Manager. Select the MM Demo configuration when prompted to select a hardware configuration. (This Quickstart assumes that you are running Micro-Manager as an ImageJ plugin, which is the most common behavior.)
- Open the On-The-Fly Processor Pipeline window by navigating to Plugins > On-The-Fly Image Processing > Configure Processors… in the Micro-Manager menu bar.
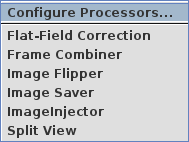
- In the window that appears, verify whether an ImageInjector processor already exists in the pipeline. If not, add one by clicking + Add… > ImageInjector.
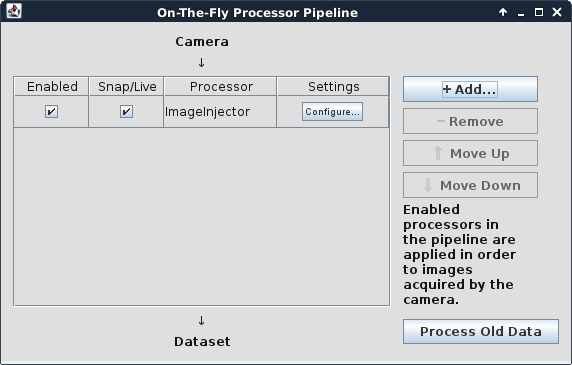
- Click the Configure… button for the ImageInjector processor.
- In the dialog that appears, click the Choose file… button and select the .tif stack of images to inject.
- We find that it helps to set the Frames per second value to something small during your initial tests, such as 5.
- Click OK when you are finished configuring the processor. You may close the configuration window at this point.
- Click the Live button in the Micro-Manager GUI window or in the Snap/Live View window if it’s already open. You should now see the images from the .tif stack stream through the Snap/Live View window.
- You can stop and restart the live stream at will. The stream will cycle back to the start of the image stack once the end is reached.
Step 3: Launch ALICA in Virtual Mode
Now that Micro-Manager has been setup to stream pre-generated images through its Snap/Live View window, we can launch ALICA and run it in virtual mode.
- Navigate to Plugins > Device Control > ALICA in the Micro-Manager menu bar.
- Select Live mode as the Image source and check the Virtual box under the options for the control device.
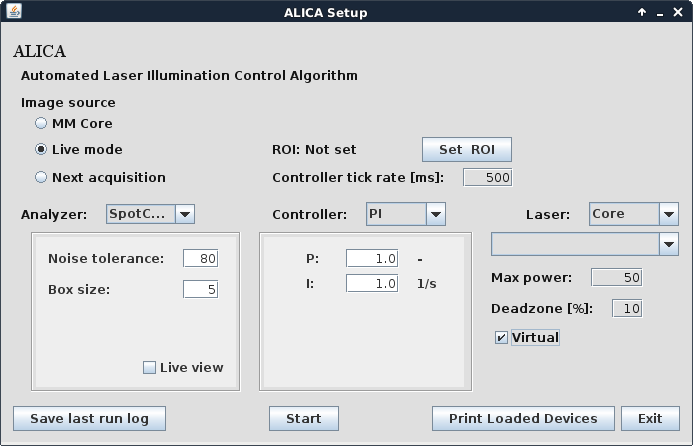
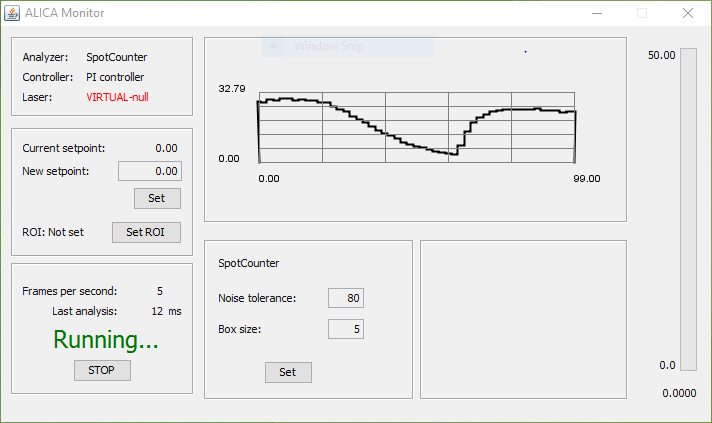
- Click Start. This will open the monitor window which provides real-time reports about the ALICA’s operation, such as fluorophore density estimates and the laser power.
- Click the Live button in the main Micro-Manager GUI window. You should see the reports in ALICA’s Monitor window respond to changes in the images streaming through the Snap/Live View window. If you don’t immediately see any change in the monitors, try stopping and starting Live mode again in the Snap/Live View window.
- When you want to close the Monitor window, click Stop in the Monitor window.
What’s Next?
Now that everything is setup, here are some further things that we recommend playing with to better understand how ALICA works.
- Check the Live view checkbox in the SpotCounter analyzer settings for a live view of the identified spots.
- Change the Analyzer from SpotCounter to AutoLase or QuickPALM for ways to estimate fluorophore densities in the images.
- Try ALICA’s virtual mode on actual experimental image stacks.
- Restrict the fluorophore density estimates to a subregion of the images by selecting a rectangular region in the Snap/Live View and clicking the Set ROI button in the ALICA Monitor window. The best way to see how this works is to use Spot Counter’s Live view setting. You can even drag the region around the field of view and watch the changes reflected in the SpotCounter’s live view in real-time.
- Use SASS to directly test different Analyzer and Controller settings outside of ALICA.